In a sluggish season for the NHL on NBC, Hockey Day in America fell to all-time lows.
 Red Wings/Penguins scored a 0.8 final rating and 1.3 million viewers in the back half of Sunday’s Hockey Day in America doubleheader on NBC, down 27% in ratings and 32% in viewership from a Blackhawks/Wild outdoor game last year (1.1, 1.9M) and down 20% and 23% respectively from Bruins/Blackhawks in 2015 (1.0, 1.6M).
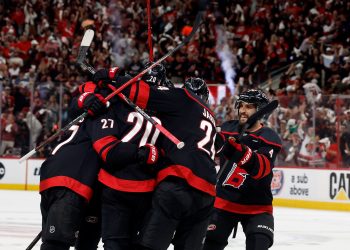
Compared to Bruins/Red Wings on the comparable day of last season, ratings fell 20% and viewership 23% from a 1.0 and 1.6 million.
The Red Wings’ comfortable win delivered the lowest rating and viewership yet for the late Hockey Day game (six telecasts dating back to 2011). The previous lows were a 0.9 and 1.4 million for Bruins/Wild in 2012.
Earlier in the day, Capitals/Rangers had a 0.6 (-14%) and 963,000 (-7%), marking the lowest rated and least-watched Hockey Day game in any window. The previous lows were a 0.7 and 1.0 million, set on multiple occasions.
Hockey Day in America continued a mediocre run for the NHL on NBC. Outside of the Winter Classic and NHL All-Star Game, none of the network’s eight windows this season has cracked a 1.0 rating. By comparison, four of NBC’s ten total indoor windows last season topped that mark.
In other action Sunday, Blackhawks/Sabres scored a 0.3 and 560,000 on NBCSN — down a tick in ratings and 19% in viewership from Red Wings/Rangers on Hockey Day last year (0.4, 694K) but up a tick and 75% respectively from Stars/Wild in 2015 (0.2, 320K). Compared to Flyers/Rangers on the comparable day last season, ratings dropped a tick and viewership 24% from a 0.4 and 738,000.
Rounding out the quadrupleheader, Bruins/Sharks drew a 0.3 and 421,000. There was no comparable window last year.
| RATINGS/VIEWERS FOR HOCKEY DAY IN AMERICA * indicates regional window, ** indicates outdoor game |
||||||
|---|---|---|---|---|---|---|
| Year | Early Window | Late Window | ||||
| Game | Rtg. | Vwrs. | Game | Rtg. | Vwrs. | |
| 2017 | Capitals Rangers |
0.6 | 963K | Red Wings Penguins |
0.8 | 1.26M |
| 2016 | Penguins Sabres |
0.7 | 1.04M | Blackhawks Wild** |
1.1 | 1.86M |
| 2015 | Capitals Flyers |
0.7 | 1.00M | Bruins Blackhawks |
1.0 | 1.63M |
| 2014 | Flyers Capitals |
0.7 | 1.02M | no late game | ||
| 2013 | Penguins Sabres |
1.1 | 1.72M | Kings Blackhawks |
1.2 | 1.81M |
| 2012 | Sharks Red Wings* |
1.3 | 1.94M | Bruins Wild |
0.9 | 1.38M |
| 2011 | Rangers Flyers* |
1.0 | 1.54M | Penguins Blackhawks |
1.1 | 1.90M |
(Wknd. numbers via ShowBuzz Daily 2.22)