If nothing else in this ratings-challenged NBA Finals, the league has plenty of company.
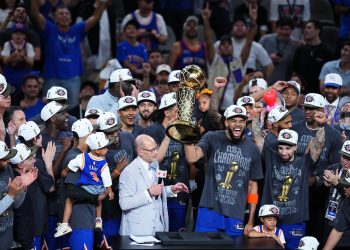
Tuesday’s Game 4 of the NBA Finals (Lakers-Heat) averaged a 4.4 rating and 7.54 million viewers on ABC, marking the highest rated and most-watched game of the series thus far. The previous marks were a 4.1 and 7.41 million for Game 1 last week. L.A.’s narrow win delivered the fourth-smallest NBA Finals audience on record, but snapped a streak of three-straight record-lows to start the series.
Through four NBA Finals games, the largest audience of the 2019-20 NBA season remains in 2019 — 8.76 million for Clippers-Lakers on ABC and ESPN Christmas Day.
The record-low numbers for the NBA Finals come amidst a broader downturn in sports TV ratings since the wave of cancellations and postponements in March. Game 4 ranks as the second-most watched (non-NFL) sportscast since March 11, behind only the Kentucky Derby (9.26M). NBA Finals games make up three of the top four and four of the top eight.
The NBA accounts for seven of the top 20 (non-NFL) sports audiences since March 11, one more than over the same period last year, when the playoffs and finals took place as scheduled in April, May and June. If the NBA remains a relatively big fish in the sporting pond, the difference is that said pond has shrunken considerably.
From March 11-October 6 of last year, 17 non-NFL sportscasts averaged at least ten million viewers. The number this year is zero. A whopping 30 averaged at least 7.5 million; the number this year is two (the Derby and Game 4).
Game 4 declined 42% in ratings and 41% in viewership from last year (Raptors-Warriors: 7.6, 12.79M) and 53% and 54% respectively from 2018 (Warriors-Cavaliers: 9.3, 16.24M). All four games of this year’s series have declined at least 40%.
The NBA is far from alone in incurring steep declines this year, joining the Stanley Cup Final (-61%), US Open of tennis (-45%), Kentucky Derby (-43%) and U.S. Open of golf (-42%) in sinking at least 40 percent. Other leagues have also posted sizable declines, if not quite as steep, with the NFL, college football and Major League Baseball regular seasons down 10, 26 and 26 percent respectively.
All of those declines come with caveats. The NBA Finals, Stanley Cup Final, Kentucky Derby and U.S. Open golf moved from their usual May and June dates to August, September and October. Baseball’s season started late and was shortened to 60 games per team. The “power five” college football conferences each started late, with some yet to begin their seasons. The NFL began as scheduled, but this past week had its schedule shaken up by postponements. In addition, virtually across the board, these events have taken place in nearly unprecedented fanless conditions.
The decline in sports viewing has corresponded with an increase in news viewing during what is an election year. Due to a prominent medical scare, the cable news audience this past Friday — a night when Game 2 averaged just 6.61 million viewers — was not only up 68% from the same Friday last year, but up 46% from the previous Friday this year.
News is taking up a greater share of what is a declining overall audience. An average of 77.2 million viewers were watching primetime television on the first three nights of the NBA Finals, a loss of more than seven million from the first three nights last year — in late May and early June (84.7M).
In a year of decline for television, Game 4 tied TV’s highest rating in adults 18-49 (2.9) since the Academy Awards in February. It tied Game 1.
Most-watched (non-NFL) sportscasts, March 11-October 6, 2020
Compared to March 11-October 6, 2019
| # | 2020 | 2019 | ||||
| Date | Event | Vwrs | Date | Event | Vwrs | |
| 1 | 9/6 | Kentucky Derby | 9.26M | 4/8 | NCAAMB Nat’l Champ. | 19.63M |
| 2 | 10/6 | NBA Finals Game 4 | 7.54M | 6/13 | NBA Finals Game 6 | 18.76M |
| 3 | 9/30 | NBA Finals Game 1 | 7.41M | 6/10 | NBA Finals Game 5 | 18.60M |
| 4 | 10/2 | NBA Finals Game 2 | 6.61M | 7/7 | Women’s World Cup Final | 16.87M |
| 5 | 4/19 | “The Last Dance” ep. 1 | 6.34M | 5/4 | Kentucky Derby | 16.34M |
| 6 | 5/17 | NASCAR Cup Series: Darlington | 6.32M | 3/31 | NCAA Elite 8 (MSU-Duke) | 16.20M |
| 7 | 4/26 | “The Last Dance” ep. 3 | 6.14M | 4/6 | NCAA Final 4 (TTU-MSU) | 15.84M |
| 8 | 10/4 | NBA Finals Game 3 | 5.94M | 6/2 | NBA Finals Game 2 | 13.89M |
| 9 | 5/17 | “The Last Dance” ep. 9 | 5.89M | 5/30 | NBA Finals Game 1 | 13.38M |
| 10 | 5/3 | “The Last Dance” ep. 5 | 5.83M | 6/5 | NBA Finals Game 3 | 13.35M |
| 11 | 4/19 | “The Last Dance” ep. 2 | 5.79M | 4/6 | NCAA Final 4 (UVA-AUB) | 12.97M |
| 12 | 5/24 | Golf: “The Match” | 5.67M | 3/24 | NCAA Rd. 2 (DUKE-UCF) | 12.88M |
| 13 | 4/26 | “The Last Dance” ep. 4 | 5.65M | 6/7 | NBA Finals Game 4 | 12.79M |
| 14 | 9/6 | NBA rd. 2 (HOU-LAL Gm. 2) | 5.43M | 4/14 | Golf: Masters final rd. | 10.81M |
| 15 | 9/15 | NBA rd. 2 (DEN-LAC Gm. 7) | 5.42M | 3/31 | NCAA Elite 8 (AUB-UK) | 10.49M |
| 16 | 5/17 | “The Last Dance” ep. 10 | 5.41M | 3/30 | NCAA Elite 8 (UVA-PUR) | 10.49M |
| 17 | 5/10 | “The Last Dance” ep. 7 | 5.34M | 3/29 | NCAA Sweet 16 (DUKE-VT) | 10.07M |
| 18 | 5/3 | “The Last Dance” ep. 6 | 5.26M | 9/21 | CFB: ND-UGA | 9.35M |
| 19 | 8/9 | Golf: PGA Champ. final rd. | 5.15M | 3/23 | NCAA Rd. 2 (UK-WOFF) | 8.96M |
| 20 | 9/17 | NBA WCF (DEN-LAL Gm. 1) | 4.92M | 3/24 | NCAA Rd. 2 (UNC-UW) | 8.92M |
[Nielsen estimates from Programming Insider 10.7, ShowBuzz Daily 10.7; NFL average from Sports Business Journal 10.7]