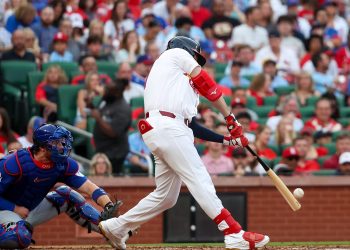
One night after the worst Game 1 in World Series TV history, Game 2 of the World Series set another record low.
 Game 2 of the Tigers/Giants World Series drew a 7.8 final rating and 12.3 million viewers on FOX, according to Nielsen fast-nationals — down 12% in ratings and 14% in viewership from Rangers/Cardinals Game 2 last year (8.9, 14.280M), and down 8% and 13%, respectively, from Rangers/Giants Game 2 in 2010 (8.5, 14.130M).
Thursday’s game ranks as the lowest rated and least-viewed Game 2 of a World Series. The previous lows were an 8.1 and 12.777 million viewers for Phillies/Rays Game 2 in 2008.
Overall, Game 2 stands as the fifth-lowest rated and fifth-least viewed World Series game ever (see table). Excluding Saturday night games, Game 2 ranks as the second-worst World Series game, ahead of only Wednesday’s Game 1 (7.6, 12.2M).
One factor to keep in mind is that Thursday’s game aired opposite live NFL coverage on NFL Network (5.165M). While that may not have been the driving force behind the record low numbers, the competition certainly did not help.
While the numbers are obviously low for the World Series, Game 2 earned the highest household rating for any primetime program on the FOX network since the season finale of “American Idol” in May (12.2).
Among adults 18-49, Game 2 drew a 3.5 rating — down 13% from both last year and 2010 (4.0 both years), and also down from Game 1 on Wednesday (3.6).
For the night, Tigers/Giants finished third among adults 18-49, behind “The Big Bang Theory” (5.0) and “Two and a Half Men” (3.7) on CBS. In P2+ viewership, the game finished fourth behind “Big Bang” (15.8M), “Half Men” (12.9M), and “Person of Interest” (14.0M).
Through two games, the 2012 World Series has averaged a 7.7 rating and 12.3 million viewers — down 13% in ratings and viewership from last year (8.8, 14.2M), and down 12% and 16%, respectively, from 2010 (8.7, 14.6M).
Tigers/Giants ranks as easily the lowest rated and least-viewed World Series ever through two games. The previous lows were an 8.6 and 13.8 million for the first two games of Phillies/Rays in 2008.
5 Lowest Rated World Series Games
| # | Date | Away | Home | Gm. # | Net | Rating | Viewers (000) | A18-49 |
|---|---|---|---|---|---|---|---|---|
| 1 | Sat., 10/25/08 | Rays | Phillies |
3
|
FOX |
6.1
|
9,836
|
3.2
|
| 2 | Sat., 10/22/11 | Cardinals | Rangers |
3
|
FOX |
6.6
|
11,247
|
3.2
|
| 3 | Sat., 10/30/10 | Giants | Rangers |
3
|
FOX |
6.7
|
11,460
|
2.9
|
| 4 | Wed., 10/24/12 | Tigers | Giants |
1
|
FOX |
7.6
|
12,240
|
3.6
|
| 5 | Thu., 10/25/12 | Tigers | Giants |
2
|
FOX |
7.8
|
12,340
|
3.5
|
Ratings/Viewership For Game 2 of the World Series
Past decade
| Year | Date | Away | Home | Net | Rating | Viewers (000) | A18-49 |
|---|---|---|---|---|---|---|---|
| 2012 | Thu., 10/25/12 | Tigers | Giants | FOX |
7.8
|
12,340
|
3.5
|
| 2011 | Thu., 10/20/11 | Rangers | Cardinals | FOX |
8.9
|
14,280
|
4.0
|
| 2010 | Thu., 10/28/10 | Rangers | Giants | FOX |
8.5
|
14,130
|
4.0
|
| 2009 | Thu., 10/29/09 | Phillies | Yankees | FOX |
11.7
|
18,897
|
5.8
|
| 2008 | Thu., 10/23/08 | Phillies | Rays | FOX |
8.1
|
12,777
|
4.0
|
| 2007 | Thu., 10/25/07 | Rockies | Red Sox | FOX |
11.1
|
16,950
|
5.3
|
| 2006 | Sun., 10/22/06 | Cardinals | Tigers | FOX |
11.6
|
18,165
|
5.9
|
| 2005 | Sun., 10/23/05 | Astros | White Sox | FOX |
11.1
|
17,190
|
5.7
|
| 2004 | Sun., 10/24/04 | Cardinals | Red Sox | FOX |
15.9
|
25,463
|
9.0
|
| 2003 | Sun., 10/19/03 | Marlins | Yankees | FOX |
12.6
|
20,552
|
7.4
|
| 2002 | Sun., 10/20/02 | Giants | Angels | FOX |
11.9
|
19,368
|
6.6
|
(Thursday’s numbers and two-game average from Fox Sports Media Group press release [.pdf]; additional information from TV By the Numbers [1], [2])