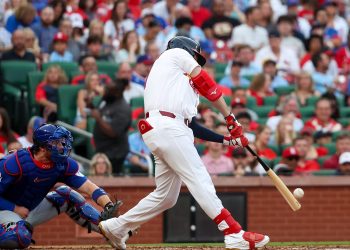
Capping a strong MLB Postseason, the World Series put up solid numbers despite a relatively quick ending.
 The five-game Royals/Mets World Series averaged an 8.7 rating and 14.7 million viewers on FOX, up 6% in ratings and 7% in viewership from last year’s seven-game Giants/Royals series (8.2, 13.8M) but down 2% and 1%, respectively, from the six-game Red Sox/Cardinals series in 2013 (8.9, 14.9M).
The series ranks as the highest rated and most-watched through five games since Yankees/Phillies in 2009 (11.4, 18.7M), topping last year by 21% in ratings and viewership (7.2, 12.1M) and 2013 by 2% and 4%, respectively (8.5, 14.1M). Four of the five games hit multi-year highs, starting with the highest rated and most-watched opener since 2009 and ending with the largest Game 5 audience since 2003.
The World Series capped a resurgent MLB postseason marked by the six largest baseball audiences on cable in the past four years. Of the 30 postseason games that can be compared to last year, 21 had increases in viewership — including all 18 that involved a National League team.
Royals/Mets still ranked low historically, averaging the fifth-lowest rating and viewership in World Series history — ahead of only last year, Giants/Tigers in 2012 (7.6, 12.7M), Giants/Rangers in 2010 (8.4, 13.6M) and Phillies/Rays in 2008 (8.4, 13.6M). This is the fourth straight year, and the sixth of the past eight, that the World Series has averaged a single-digit rating.
The series was done no favors by the schedule. Game 2 faced a Republican primary debate on CNBC, which in any other election cycle would have earned three or four million viewers. This year, it had 14.0 million. Games 3 and 4 took place on the least-watched nights of the week — Friday and Saturday — to reduce NFL competition. Finally, Game 5 aired opposite a battle of undefeated teams on NBC’s Sunday Night Football, which put up the strongest numbers yet for SNF opposite a World Series game.
Among adults 18-49, Royals/Mets averaged a 4.1 rating among adults 18-49, up 14% from last year (3.7) but down a tick from 2013 (4.2). Compared to last year’s five-game average, the 4.1 improved by 31% over a 3.1.
Compared to other sports, the World Series trailed January’s College Football Playoff on ESPN (16.0, 29.8M) and April’s NCAA Final Four on CBS and Turner Sports (12.2, 21.7M). It also trailed the Warriors/Cavaliers NBA Finals in June, which had an 11.6, 19.9 million and a 7.6 in the demo — marking the sixth straight year and the seventh of the past eight that the World Series has finished behind its NBA counterpart.

(This year’s numbers from Fox Sports)