Game 1 of the World Series earned one of the lowest television ratings in the history of the event, though the numbers were down only slightly from last year.
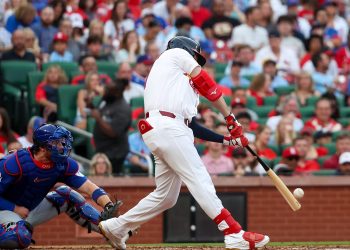
 Wednesday’s Rangers/Cardinals Game 1 drew an 8.7 final rating and 14.174 million viewers on FOX, down 2% in ratings and 6% in viewership from last year (TEX/SF G1: 8.9, 15.009M), and down 27% in both measures compared to 2009 (PHI/NYY G1: 11.9, 19.511M).
The Cardinals’ win ranks as the second-lowest rated and second-least viewed Game 1 in World Series history, ahead of only Cardinals/Tigers Game 1 in 2006 (8.0, 12.840M). Keep in mind the 2006 game was the last Game 1 to take place on a Saturday night, the lowest rated night of the week.
Excluding Saturday night games, Game 1 ranks as the third-lowest rated World Series game, ahead of only Rangers/Giants Game 2 last year (8.5) and Phillies/Rays Game 2 in 2008 (8.1).
Despite the historic lows, Game 1 put in a decent performance for FOX all things considered. Though the #5 market Rangers are in the World Series for the second straight year, the #21 Cardinals have replaced the #6 market Giants. Overall, this year’s home markets combine for 3.8 million TV households, down 25% from last year (5.1 million).
Among adults 18-49, Wednesday’s game earned a 4.2 rating — down 11% from last year (4.7) and down 33% from 2009 (6.3).
Game 1 was the top program of the night in household ratings and viewership, but placed a distant second among adults 18-49, behind ABC’s Modern Family (5.7). FOX won the night in primetime in all three categories.
For some perspective, Game 1 of the Mavericks/Heat NBA Finals drew a 9.0 final rating and 15.171 million viewers on ABC in May, with a 6.5 among adults 18-49.
Though the relatively small gap between the high-profile NBA Finals and this year’s World Series may seem encouraging, keep in mind the main difference between the two events — NBA Finals ratings typically rise from game to game, while World Series ratings over the past three years have dropped from Game 1 to Game 3.
10 Lowest Rated World Series Games
|
#
|
Date
|
Game
|
#
|
Series
|
Net
|
U.S. Rating
|
Viewers (000)
|
|---|---|---|---|---|---|---|---|
|
1
|
Sat., 10/25/08 | TB 4, PHI 5 |
3
|
PHI 2-1
|
FOX |
6.1
|
9,836
|
|
2
|
Sat., 10/30/10 | SF 2, TEX 4 |
3
|
SF 2-1
|
FOX |
6.7
|
11,460
|
|
3
|
Sat., 10/21/06 | STL 7, DET 2 |
1
|
STL 1-0
|
FOX |
8.0
|
12,840
|
|
4
|
Thu., 10/23/08 | PHI 2, TB 4 |
2
|
TIE 1-1
|
FOX |
8.1
|
12,777
|
|
T5
|
Thu., 10/28/10 | TEX 0, SF 9 |
2
|
SF 2-0
|
FOX |
8.5
|
14,130
|
|
T5
|
Sat., 10/27/07 | BOS 10, COL 5 |
3
|
BOS 3-0
|
FOX |
8.5
|
14,055
|
|
7
|
Wed., 10/19/11 | TEX 2, STL 3 |
1
|
STL 1-0
|
FOX |
8.7
|
14,174
|
|
8
|
Mon., 11/1/10 | SF 3, TEX 1 |
5
|
SF 4-1
|
FOX |
8.8
|
14,950
|
|
9
|
Wed., 10/27/10 | TEX 7, SF 11 |
1
|
SF 1-0
|
FOX |
8.9
|
15,009
|
|
10
|
Sun., 10/31/10 | SF 4, TEX 0 |
4
|
SF 3-1
|
FOX |
9.0
|
15,537
|
(This year’s numbers from Fox Sports Media Group press release via TV By the Numbers; additional information from The Voice of TV)