Of the four major sports, the NBA and Major League Baseball are the closest competitors when it comes to television ratings. With the World Series now over, here is a look at how the two leagues stacked up against each other nationally in ’09.
Regular season
During the 2008-09 regular season, all three NBA television partners saw increases in ratings and viewership. ABC had its most-viewed NBA season since 2002-03 (2.3, 3.7 mil), ESPN had its most-viewed NBA season ever (1.1, 1.7 mil) and TNT had its most-viewed season since 1995-96 (1.1, 1.7 mil).
For each of the three networks, the 2008-09 season marked the second-straight year of increases.
Meanwhile, two of the three MLB television partners saw declines during the 2009 baseball season. FOX (1.8, 2.7 mil) had its fifth-straight season of declining ratings, and its lowest rated season ever. ESPN (1.1, 1.6 mil) had an 8% decline in ratings. TBS, in its second season carrying Sunday games, was the only MLB television partner to have a rise in ratings — but the net averaged a mere 0.6 U.S. rating and 930,000 viewers.
Advantage: NBA. Not only did the NBA outdraw Major League Baseball on both broadcast and cable during the 2009 regular season, but the overall trend appears to be in the NBA’s favor. This was the second straight year of growth for the NBA, and the second straight year that the league outdrew Major League Baseball on broadcast.
Playoffs — early rounds
The first two rounds of the NBA Playoffs averaged approximately 4 million viewers across the NBA’s three television partners — including 4.9 million viewers on ABC, 4 million on TNT and 3.4 million on ESPN. TNT averaged a record 3.4 million viewers for the first round, including Celtics/Bulls Game 6 (5.4 mil) and Bulls/Celtics Game 7 (7.0 mil) — the two most-viewed first round games ever on cable.
The second round of the playoffs was the most-viewed ever on TNT (5.1 mil) and ESPN (4.6 mil).
Meanwhile, the MLB Division Series averaged 4.8 million viewers on TBS, up 11% from 2008. The most-viewed game was the Yankees’ series-clincher against the Twins, which drew 6.8 million viewers.
The Division Series gave TBS the most-viewed week in the network’s 33-year history, as the network set records in total day viewers, households, adults 18-34, adults 18-49 and 25-54.
Advantage: Push. Despite airing exclusively on cable, the MLB Division Series outdrew the first two rounds of the NBA Playoffs, which had the advantage of 9 games on broadcast. Still, the NBA drew the largest audiences, as 5 early round playoff games drew more viewers than the most-viewed Division Series game.
Keep in mind that three of the four Division Series ended in sweeps — and none went to a decisive Game 5. Meanwhile, the NBA had four of its early round series go to Game 7, no doubt helping ratings.
Playoffs — Conference/League championships
The NBA Conference Finals averaged 8.6 million viewers on ESPN, ABC and TNT last May. The Conference Finals featured the three most-viewed NBA games ever on cable, topped by Cavaliers/Magic Game 4 on TNT (10.1 mil).
The Magic/Cavaliers East Finals on TNT averaged 8.6 million viewers, the most-viewed East Final since ’01. Meanwhile, the Lakers/Nuggets West Finals on ESPN/ABC averaged 8.7 million, the most-viewed West Final since ’02.
By comparison, the MLB League Championship Series averaged 8.4 million viewers on FOX and TBS, topped by the most-viewed non-Game 7 LCS game since 2004 (Angels/Yankees Game 6; 15.5 mil).
FOX averaged 10.3 million viewers for the Yankees/Angels ALCS, while TBS averaged 6.0 million for the NLCS. Both series were up from the previous year.
Advantage: Push: The NBA Conference Finals edged the MLB League Championship Series in ’09, an especially impressive feat considering that 11 of the 12 Conference Final games aired on cable, while 6 of the 11 LCS games aired on broadcast. Comparing the two series that aired exclusively on cable (Magic/Cavaliers on TNT and Phillies/Dodgers on TBS), the NBA came out on top by a 45% margin (8.7 million for ECF on TNT, 6 million for NLCS on TBS).
However, while the Conference Finals were the bigger draw overall, the League Championship Series (specifically the ALCS) attracted the largest audiences. The final three games of the Yankees/Angels series drew 10.3 million, 11.9 million and 15.5 million viewers — each topping the peak viewership for the Conference Finals (10.1 million for Magic/Cavaliers Game 4). The Yankees/Angels series as a whole averaged over 10 million viewers.
Playoffs — Championship Round
The Lakers/Magic NBA Finals averaged an 8.4/14 rating and 14.3 million viewers on ABC, down from the previous year, but the second-most viewed NBA Finals since ’04. The series peaked with a 9.4 and 16 million for Game 4.
Meanwhile, the Yankees/Phillies World Series averaged an 11.7/19 rating and 19.4 million viewers on FOX, up significantly from the previous year, and the highest rated, most-viewed World Series since ’04. Like the NBA Finals, the World Series peaked in Game 4, drawing a 13.5 and 22.8 million viewers.
Advantage: MLB. After last year’s NBA Finals outdrew the World Series — for the first time since 1998 — order was restored this year. The World Series topped the NBA Finals by 39% in ratings (11.7 to 8.4) and 36% in viewership (19.4 mil to 14.3 mil). The NBA Finals beat the World Series in the adults 18-34 demo (5.7 to 5.4) and men 18-34 demo (6.8 to 6.5), but the World Series prevailed among adults 18-49 (6.2 to 5.7) and 25-54 (6.8 to 5.9) and men 18-49 (7.8 to 7.1) and 25-54 (8.7 to 7.4).
For the decade, 53 World Series games averaged 19.3 million viewers, while 54 NBA Finals games averaged 14.4 million — a difference of 34%. The gap between the two events actually widened during the 2000s; in the 1990s, 50 World Series games averaged 27.3 million viewers, 22% higher than 22.4 million for 56 NBA Finals games.
Both the World Series and the NBA Finals have shed approximately 8 million viewers since the 1990s.
Overall
During the regular season and the early rounds of the playoffs, the NBA and Major League Baseball drew very similar numbers — but the 2009 World Series re-established that the crown jewel of the baseball season is still a bigger deal to television viewers than the crown jewel of the NBA season.
That disparity between the two marquee events is what separates the two leagues.
One positive for the NBA: even with the large gap between Yankees/Phillies and Lakers/Magic, the NBA Finals still prevailed among adults 18-34 and men 18-34.
Advantage: MLB. Not only did the World Series outdraw the NBA Finals by 39%, but the MLB Postseason as a whole topped the entire NBA Playoffs by 67% (9 million to 5.4 million).
Of course, there were just 30 MLB posteason games, compared to 78 NBA Playoff games (not counting games aired on NBA TV). The NBA had 60 early round playoff games (usually the least-viewed in a given postseason), compared to just 13 for Major League Baseball — and the round-by-round numbers tell a much different story.
That said, considering the massive advantage Major League Baseball has for both the World Series and the postseason as a whole, the conclusion here is one that should not surprise: MLB, as it has been traditionally, is the better television draw.
MLB vs. NBA during 2009
| Event | NBA | MLB | ||||
|---|---|---|---|---|---|---|
| Viewers | Net | # of gms | Viewers | Net | # of gms | |
| Regular season |
3.7 mil
|
ABC |
18
|
2.7 mil
|
FOX |
26
|
|
1.7 mil
|
TNT |
53
|
930,000
|
TBS |
28
|
|
|
1.7 mil
|
ESPN |
71
|
1.6 mil
|
ESPN |
66
|
|
| Playoffs (early rds) |
4.9 mil
|
ABC |
9
|
4.8 mil
|
TBS |
13
|
|
4.0 mil
|
TNT |
37
|
||||
|
3.4 mil
|
ESPN |
14
|
||||
| Conf. Finals / LCS |
8.7 mil
|
ESPN, ABC |
6
|
10.3 mil
|
FOX |
6
|
|
8.6 mil
|
TNT |
6
|
6.0 mil
|
TBS |
5
|
|
| Championship rounds |
14.3 mil
|
ABC |
5
|
19.4 mil
|
FOX |
6
|
Viewership for the NBA Finals and World Series since 2000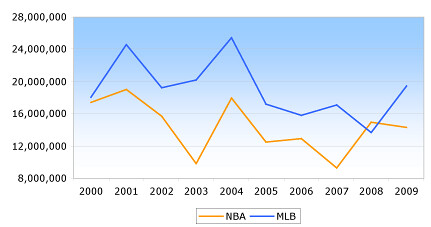
Ratings for the 2009 NBA Finals and 2009 World Series