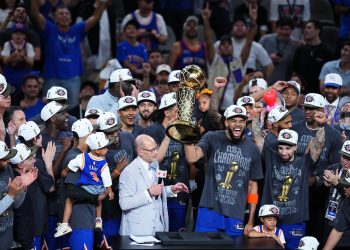
It was not an especially dramatic championship run, but the Warriors’ coronation delivered one of the NBA’s biggest TV audiences since the end of the Bulls’ run.
 Monday’s Cavaliers-Warriors NBA Finals Game 5 earned a 13.5 final rating and 24.5 million viewers on ABC, up 14% in ratings and 19% in viewership from last year (11.8, 20.5M) and up 14% and 17% respectively from 2015 (11.8, 20.9M), both of which featured the same two teams.
The Warriors’ title-clinching win ranks as the highest rated Game 5 of the NBA Finals since Lakers-Pistons in 2004 (13.8) and the most-watched since Jazz-Bulls in 1998 (30.5M).
Overall, it was the seventh-highest rated and fourth-most watched NBA game since 1998. In the latter measure, it trailed only three NBA Finals game sevens — Cavaliers-Warriors last year (31.0M), Celtics-Lakers in 2010 (28.2M) and Spurs-Heat in 2013 (26.3M). Cleveland-Golden State games now make up four of the top ten.
Game 5 earned a streaming audience of 537,000 viewers on WatchESPN, up 41% from last year (380K) and the second-largest streaming audience for an NBA game. Last year’s Game 7 had 598,000. Adding those viewers to the mix, Game 5 had a 25.0 million viewers — still the fourth-best for any game since 1998. Viewership peaked at 29.5 million at 11:30 PM ET.
For the year, Game 5 ranks second in ratings and viewership among non-NFL sporting events, trailing the Clemson-Alabama college football national championship on ESPN, ESPN2 and ESPNU in January (14.2, 25.3M). It topped the North Carolina-Gonzaga men’s basketball title game on CBS in April (13.2, 23.0M), marking the third time in the past five years that the NBA has delivered the year’s top basketball audience.
Game 5 earned a 9.0 rating in adults 18-49, up 18% from last year and 2015 (7.6 both years). The 9.0 is the highest for a Game 5 since Lakers-Pistons in 2004 (9.4) and the fifth-highest for any NBA game over that span. Outside of the NFL, it ranks as TV’s second-best rating in the demo this year, just a tick behind the Academy Awards (9.1).
The game had an 8.3 in adults 18-34, up 15% from last year (7.2), up 11% from 2015 (7.5) and the highest Game 5 rating in the demo since at least 2004.
| MOST-WATCHED NBA GAMES SINCE 1998 | |||||
|---|---|---|---|---|---|
| # | Year | Game | Net | Rtg. | Vwrs. |
| 1 | 2016 | Cavaliers-Warriors NBA Finals Game 7 |
ABC | 15.8 | 31.02M |
| 2 | 2010 | Celtics-Lakers NBA Finals Game 7 |
ABC | 15.6 | 28.20M |
| 3 | 2013 | Spurs-Heat NBA Finals Game 7 |
ABC | 15.3 | 26.32M |
| 4 | 2017 | Cavaliers-Warriors NBA Finals Game 5 |
ABC | 13.5 | 24.47M |
| 5 | 2011 | Mavericks-Heat NBA Finals Game 6 |
ABC | 13.3 | 23.88M |
| 6 | 2002 | Lakers-Kings West Final Game 7 |
NBC | 14.4 | 23.80M |
| 7 | 2015 | Warriors-Cavaliers NBA Finals Game 6 |
ABC | 13.4 | 23.25M |
| 8 | 2000 | Pacers-Lakers NBA Finals Game 6 |
NBC | 14.7 | 22.40M |
| 9 | 2004 | Lakers-Pistons NBA Finals Game 5 |
ABC | 13.8 | 21.84M |
| 10 | 2015 | Cavaliers-Warriors NBA Finals Game 5 |
ABC | 11.8 | 20.86M |
[Mon. numbers from ESPN, with additional info from ShowBuzz Daily 6.13]