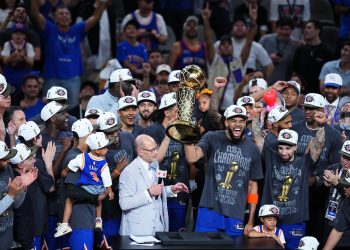
Though viewership for the 2011 NBA Finals declined for a fourth straight game, Thursday’s Game 5 ranks among the most-viewed NBA games of the past ten seasons.
 Heat/Mavericks Game 5 drew a 10.8 final rating and 18.318 million viewers on ABC Thursday night, flat in ratings and down 2% in viewership from last year (LAL/BOS G5: 10.8, 18.654M), but up 35% and 29%, respectively, from 2009 (LAL/ORL G5: 8.0, 14.171M).
The game easily outpaced Mavericks/Heat Game 5 in 2006 (9.1, 14.318M).
Thursday’s game ranks as the second-most viewed Game 5 of the NBA Finals since 2004 (LAL/DET G5: 13.8, 21.843M), and the sixth-most viewed NBA Finals game overall over the past ten seasons (dates back to the 2001-02 season).
Excluding NBA Finals that involved the Lakers, the game stands as the highest rated Game 5 since 1999 (SA/NY G5: 11.0, NBC) and the most-viewed since 1998 (UTA/CHI G5: 30.59M, NBC).
Overall, of the 33 NBA Finals games since the 1998-99 lockout that did not feature the Lakers, Heat/Mavericks Game 5 ranks as the second-most viewed. Only Game 7 of the 2005 Spurs/Pistons NBA Finals drew a larger audience (18.997M).
Like Game 4 on Tuesday night, Game 5 drew more viewers than every single game of the 2010 World Series. The game ranks as the fourth-most viewed non-NFL sporting event of the calendar year, behind only the NCAA Men’s National Championship Game (CONN/BUT: 20.055M, CBS), the Rose Bowl (TCU/WISC: 20.558M, ESPN), and the BCS National Championship Game (AUB/ORE: 27.316M, ESPN).
Thursday’s game drew a 7.4 rating in the key adults 18-49 demographic, up 3% from last year (7.2), up 30% from 2009 (5.7), and the highest Game 5 rating in the demo since 2004 (9.4). When series-clinching games are excluded, the 7.4 ranks as the second-highest adults 18-49 rating for an NBA Finals game on ABC since the network reacquired rights to the league in 2002.
The game also drew a 7.7 rating among adults 18-34, the highest for a Game 5 in that demographic since 2004.
Outside of Florida and Texas, Game 5 drew above-average numbers in NBA markets Cleveland (18.1), New Orleans (16.9), Oklahoma City (15.9), Chicago (15.1), Memphis (15.0), Orlando (14.6), Los Angeles (14.4), Atlanta (14.0), Washington, D.C. (13.3), Detroit (12.5), Charlotte (12.4), Indianapolis (12.3), New York (11.7), Portland (11.4), and Salt Lake City (11.1).
There were several NBA markets that performed below the national average, including consistent underperformers Boston (6.5) and Minneapolis-St. Paul (6.1).
Most-Viewed NBA Finals Games since 1998-99 Lockout
That did not involve the Los Angeles Lakers

(This year’s numbers from abcmedianet.com, Son of the Bronx)