The American League Championship Series has continued to post solid numbers on FOX.
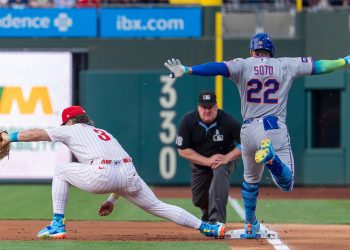
Game 5 of the Red Sox/Tigers ALCS earned a 5.4 final rating and 8.6 million viewers on FOX Thursday night, up 23% in ratings and 21% in viewership from Giants/Cardinals Game 5 on a Friday night last year (4.4, 7.1M), and up 39% and 51%, respectively, from Rangers/Tigers Game 5 on a Thursday afternoon in 2011 (3.9, 5.7M).
Thursday’s game ranks as the most-viewed League Championship Series telecast on any network since 2010, and the top playoff game outside of the World Series since Game 5 of the Tigers/Yankees ALDS on TBS in 2011 (9.7M).
On Wednesday night, Game 4 of the series drew a 5.2 and 8.1 million viewers — up 37% in ratings and 35% in viewership from Giants/Cardinals Game 4 last year (3.8, 6.0M), but down 2% and 3%, respectively, from Rangers/Tigers in 2011 (5.3, 8.4M).
Through five games, the series has averaged a 4.7 rating and 7.5 million viewers on FOX — up 27% in ratings and viewership from last year (3.7, 5.9M).
Shifting to the NLCS, Game 5 of the Cardinals/Dodgers series drew 3.7 million viewers on TBS — down 32% from Brewers/Cardinals Game 5 in primetime two years ago (5.5M). There was no comparable game of last year’s Tigers/Yankees series.
As should be expected, the two afternoon games rank as the least-viewed of the series.
Viewership For First Five Games of the League Championship Series on FOX
Past five seasons
^ indicates afternoon game
| Year | Series | Net | Gm. 1 | Gm. 2 | Gm. 3 | Gm. 4 | Gm. 5 |
|---|---|---|---|---|---|---|---|
| 2013 | Red Sox-Tigers | FOX |
6.8M
|
8.3M
|
5.6M^
|
8.1M
|
8.6M
|
| 2012 | Cardinals-Giants | FOX |
6.8M
|
5.6M
|
3.9M^
|
6.0M
|
7.1M
|
| 2011 | Rangers-Tigers | FOX |
5.8M
|
6.6M^
|
8.4M
|
8.4M
|
5.7M^
|
| 2010 | Giants-Phillies | FOX |
7.1M
|
8.8M
|
5.0M^
|
9.3M
|
11.2M
|
| 2009 | Yankees-Angels | FOX |
8.4M
|
9.4M
|
7.2M^
|
10.3M
|
11.9M
|
Viewership For First Five Games of the League Championship Series on TBS
Past five seasons
^ indicates afternoon game
| Year | Series | Net | Gm. 1 | Gm. 2 | Gm. 3 | Gm. 4 | Gm. 5 |
|---|---|---|---|---|---|---|---|
| 2013 | Cards-Dodgers | TBS |
5.5M
|
3.4M^ | 4.8M |
5.8M
|
3.7M^
|
| 2012 | Tigers-Yankees | TBS |
6.8M
|
5.0M^
|
6.2M
|
5.3M^
|
None
|
| 2011 | Cards-Brewers | TBS |
3.4M^
|
3.0M
|
4.3M
|
5.7M
|
5.5M
|
| 2010 | Rangers-Yankees | TBS |
8.1M
|
5.8M^
|
8.2M
|
9.8M
|
6.1M^
|
| 2009 | Phillies-Dodgers | TBS |
6.8M
|
4.4M^
|
5.0M |
5.6M
|
8.0M
|
(This year’s numbers from Fox Sports, TV By the Numbers)