The viewership story for NASCAR’s Coca-Cola 600 depends on the methodology.
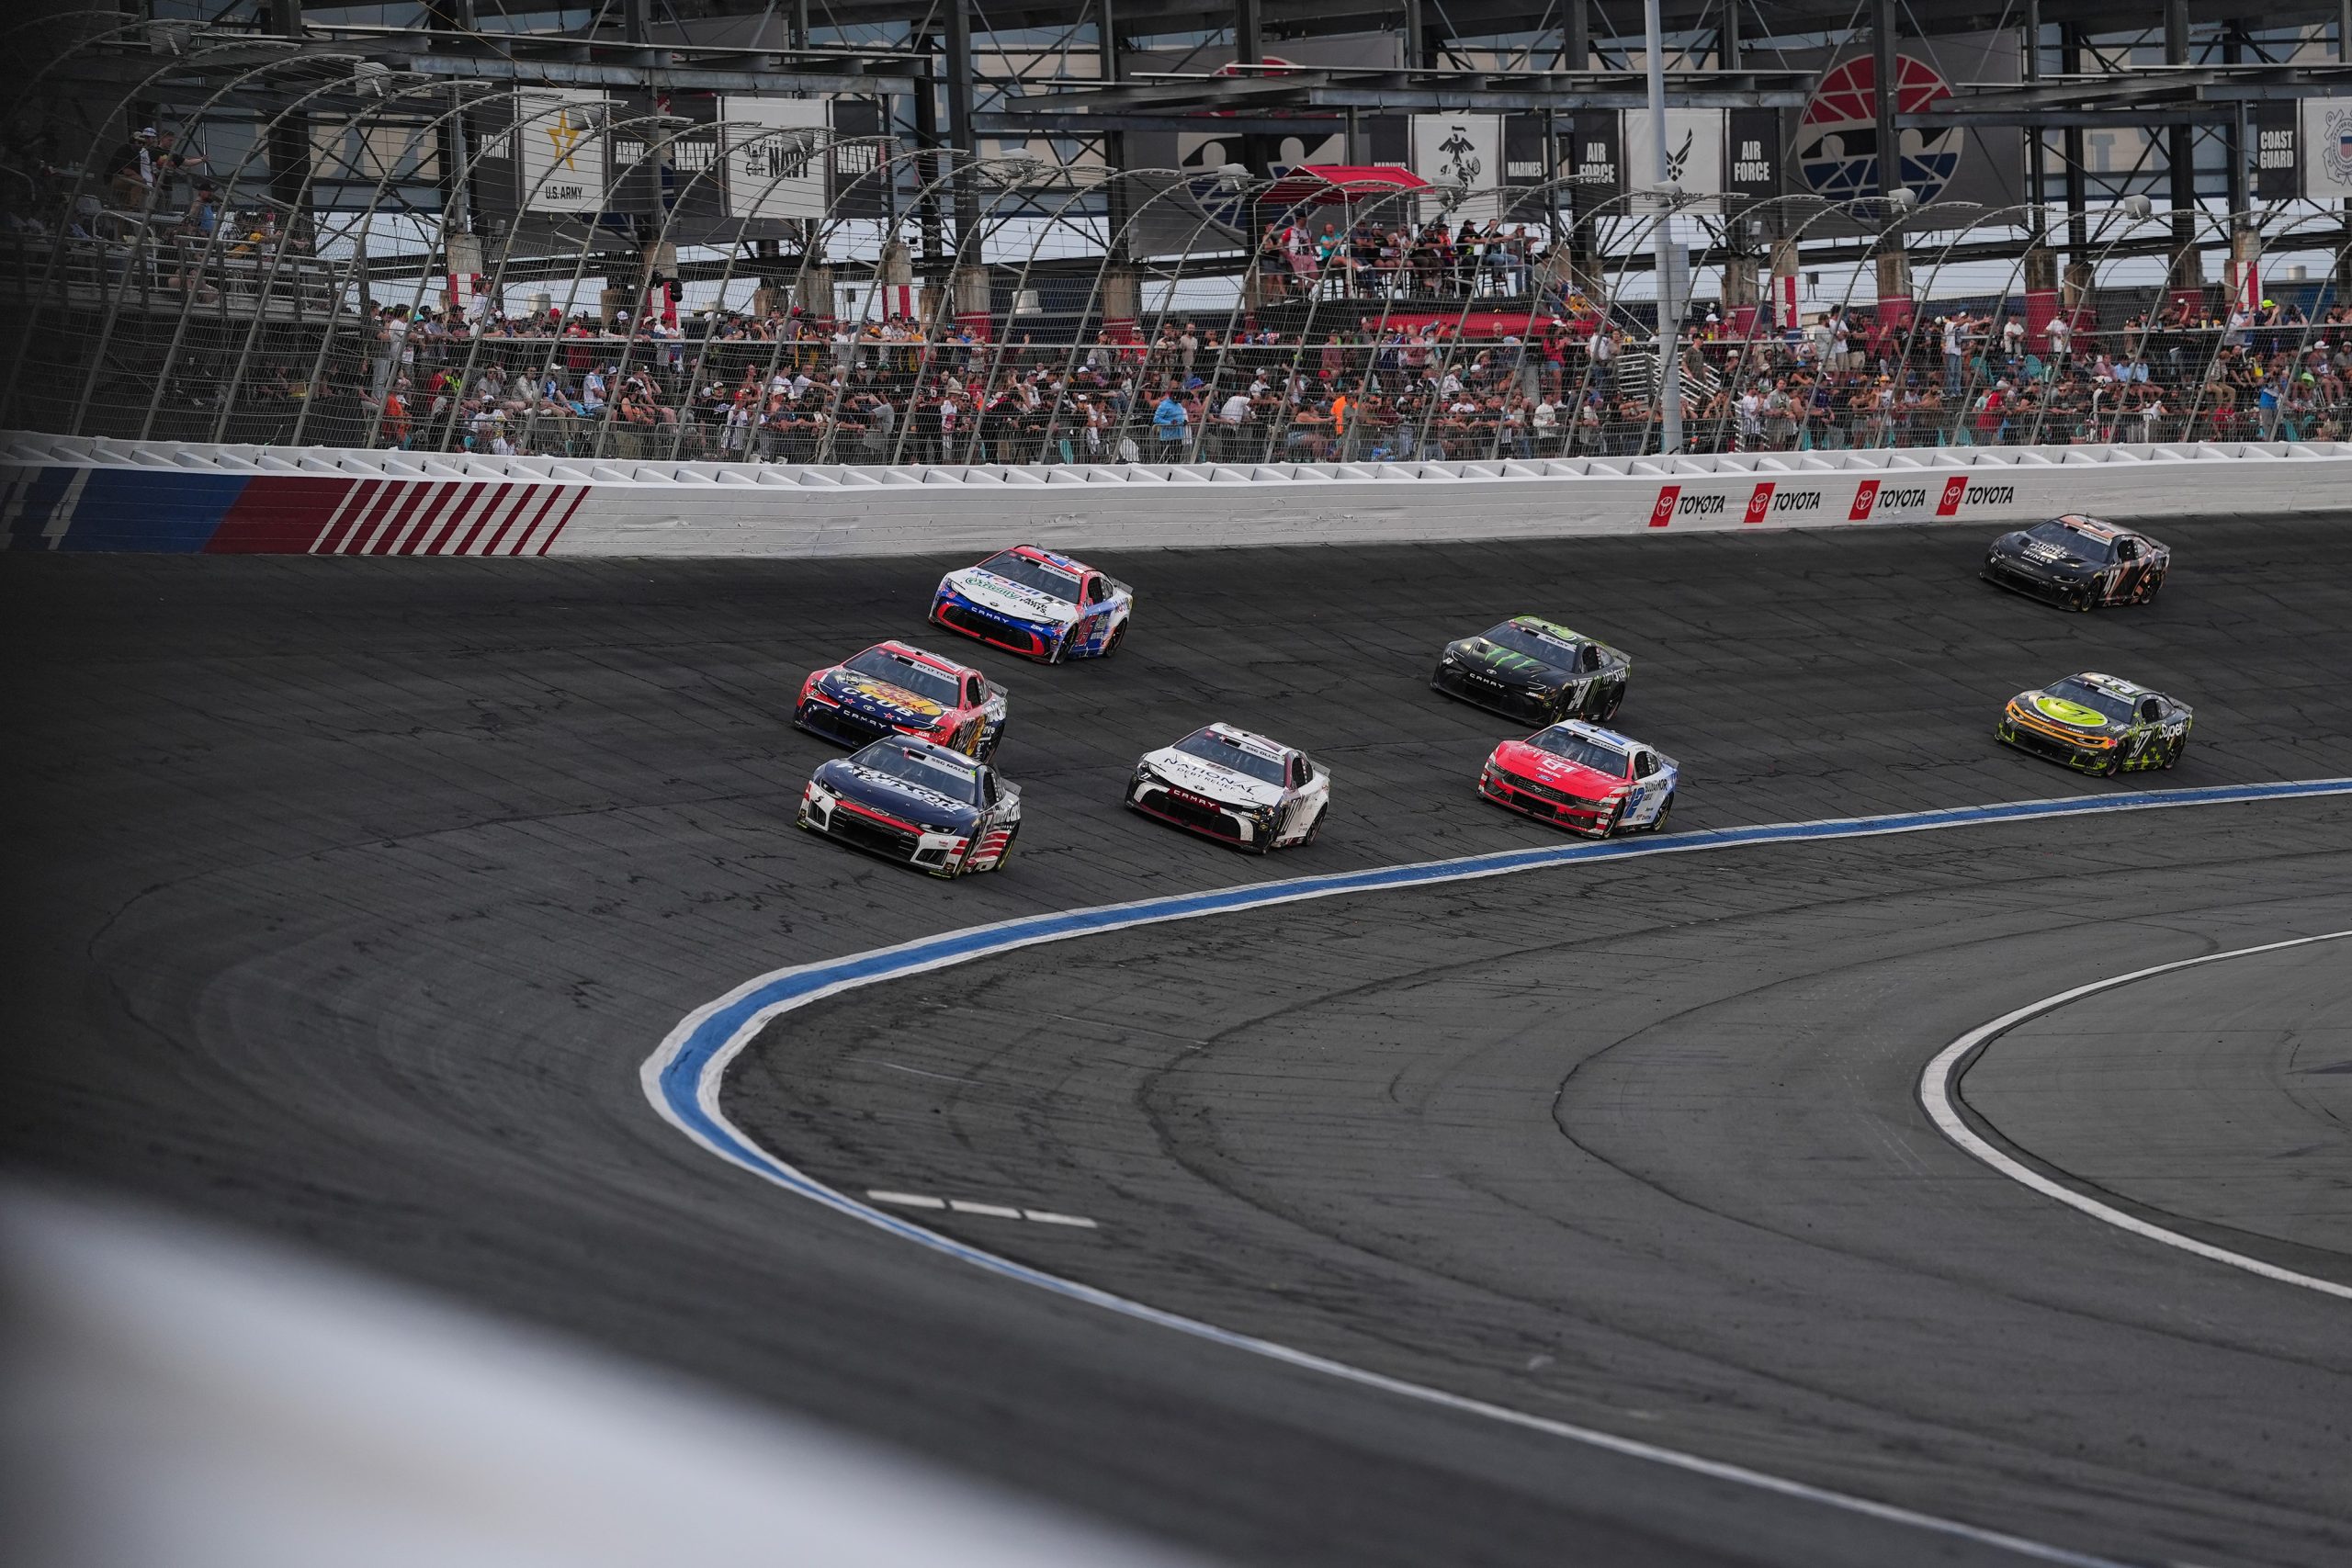
Last weekend’s NASCAR Coca-Cola 600 from Charlotte Motor Speedway averaged a 1.3 rating and 3.06 million viewers on Amazon Prime Video, per the official Nielsen “Big Data + Panel” currency — up a tick in ratings and 12% in viewership from last year’s “Big Data + Panel” figure (1.2, 2.72M). On a “panel-only” basis, which is the methodology NASCAR is now reporting for its races, the 600 had a 1.1 rating and 2.65 million, flat and up 1% respectively from last year (1.1, 2.62M).
It is Nielsen policy to compare present-day “Big Data + Panel” figures to last year’s panel-only numbers. On that basis, the Coca-Cola 600 was officially up 18% in ratings (from 1.1 to 1.3) and 17% in viewership (from 2.62 to 3.06 million).
The difference between the “Big Data” and panel-only figures — 15% — is substantially greater than last year (+3%) and also far beyond what has been typical for NASCAR races. For the previous week’s All-Star Race, the “Big Data” figure (1.68M) was actually 7% lower than its panel-only equivalent (1.80M). The previous Cup points races prior to Charlotte were also averaging fewer viewers under “Big Data” (3.34M) than panel-only (3.4M).
It is not exactly clear why NASCAR performed so much better in the “Big Data + Panel” metric this past week as compared to last year or previous weeks this season. Prime Video is one of the few platforms whose first-party viewership estimates are included in the “Big Data” figure — a step the linear networks have thus far not taken — but that was also true last year.
The gap between the methodologies extended to every aspect of the data. On a “Big Data” basis, Sunday’s audience peaked at 3.37 million in the 9:15 PM ET quarter-hour, 15% higher than last year’s peak. On a panel-only basis, it peaked two hours earlier at 3.1 million during the 7:15 PM ET quarter-hour.
Notably, the median age under “Big Data + Panel” was 57.2, actually higher than on a panel-only basis (56.5). On a “Big Data + Panel” basis, viewership increased 20% from last year among adults over 55 (1.41 to 1.69M). A comparable panel-only figure was not immediately available.
That there is so much variance in the data between the methodologies would seem to indicate that at this point, discussion of sports viewership may have more to do with how those numbers are calculated than any actual viewer behavior. One could tell two completely different stories about viewership for the race, with “Big Data + Panel” indicating a growing, slightly older, audience that rose as the race went on, and panel-only signaling a flat audience that topped out relatively early.
It is entirely possible that the same could be said of any number of other sports properties over the past year. The only reason it is possible to compare the methodologies is because NASCAR has shifted away from reporting “Big Data + Panel” and returned to publicizing its panel-only figures.
No matter the methodology, the Coca-Cola 600 was no match for the Indianapolis 500 on FOX earlier in the day (3.3, 6.6M). Keep in mind it faced tough competition from a pair of conference final games — Thunder-Spurs Game 4 in the NBA (10.30M per Nielsen/Adobe Analytics) and Avalanche-Golden Knights Game 3 in the NHL (2.48M).